
Sugar Crash

The ABC’s of bureaucracy, R. Jansen (1922)
It will be interesting to read (in about five years) some good economic analysis on the COVID fiscal expenditure. It is important research: fiscal stimulus is being partly blamed for the inflation we have now. The uniform presence of inflation, across many countries with a variety of types of stimulus, calls this into question.
Furthermore, the problem with fiscal is always that it relies on government bureaucracy to get the money to the right people. In the US, for instance, it’s estimated that for every $1 paid out in wages, it cost the stimulus program $4.13! (NYT article).
Questions are being asked as to how global economies are slipping so quickly into slowdowns after so much stimulus was unleashed. It’s a pretty good indication that the stimulus never did much of its job in the first place; it’s the belief that got us this far (as it so often does).
Sunday Twitter Poll
The last FOUR weeks, Twitter has been bullish but the market has ended the week down. Fifth time now - and there’s a larger swing in favour of bulls. Quite interested to see how this one plays out….
(Of the last 18,000 tweets containing SPX, $SPY or $ES, those including bull/bulls/bullish/bear/bears/bearish extracted, then % totals of each. Started April 2022; plan to track % of times Twitter is correct compared to the following weekly close. Tracking data will be added after the first 20 weeks.)
Roadmap
A big week on the data front:
Tuesday - preliminary PMI’s
Wednesday - FOMC minutes
Thursday - US preliminary GDP (second estimate)
Attention drifts from one area of data to another but there’s a decent chance it is currently moving from inflation data to productivity data, given that the words ‘economic slowdown’ are on everyone’s lips.
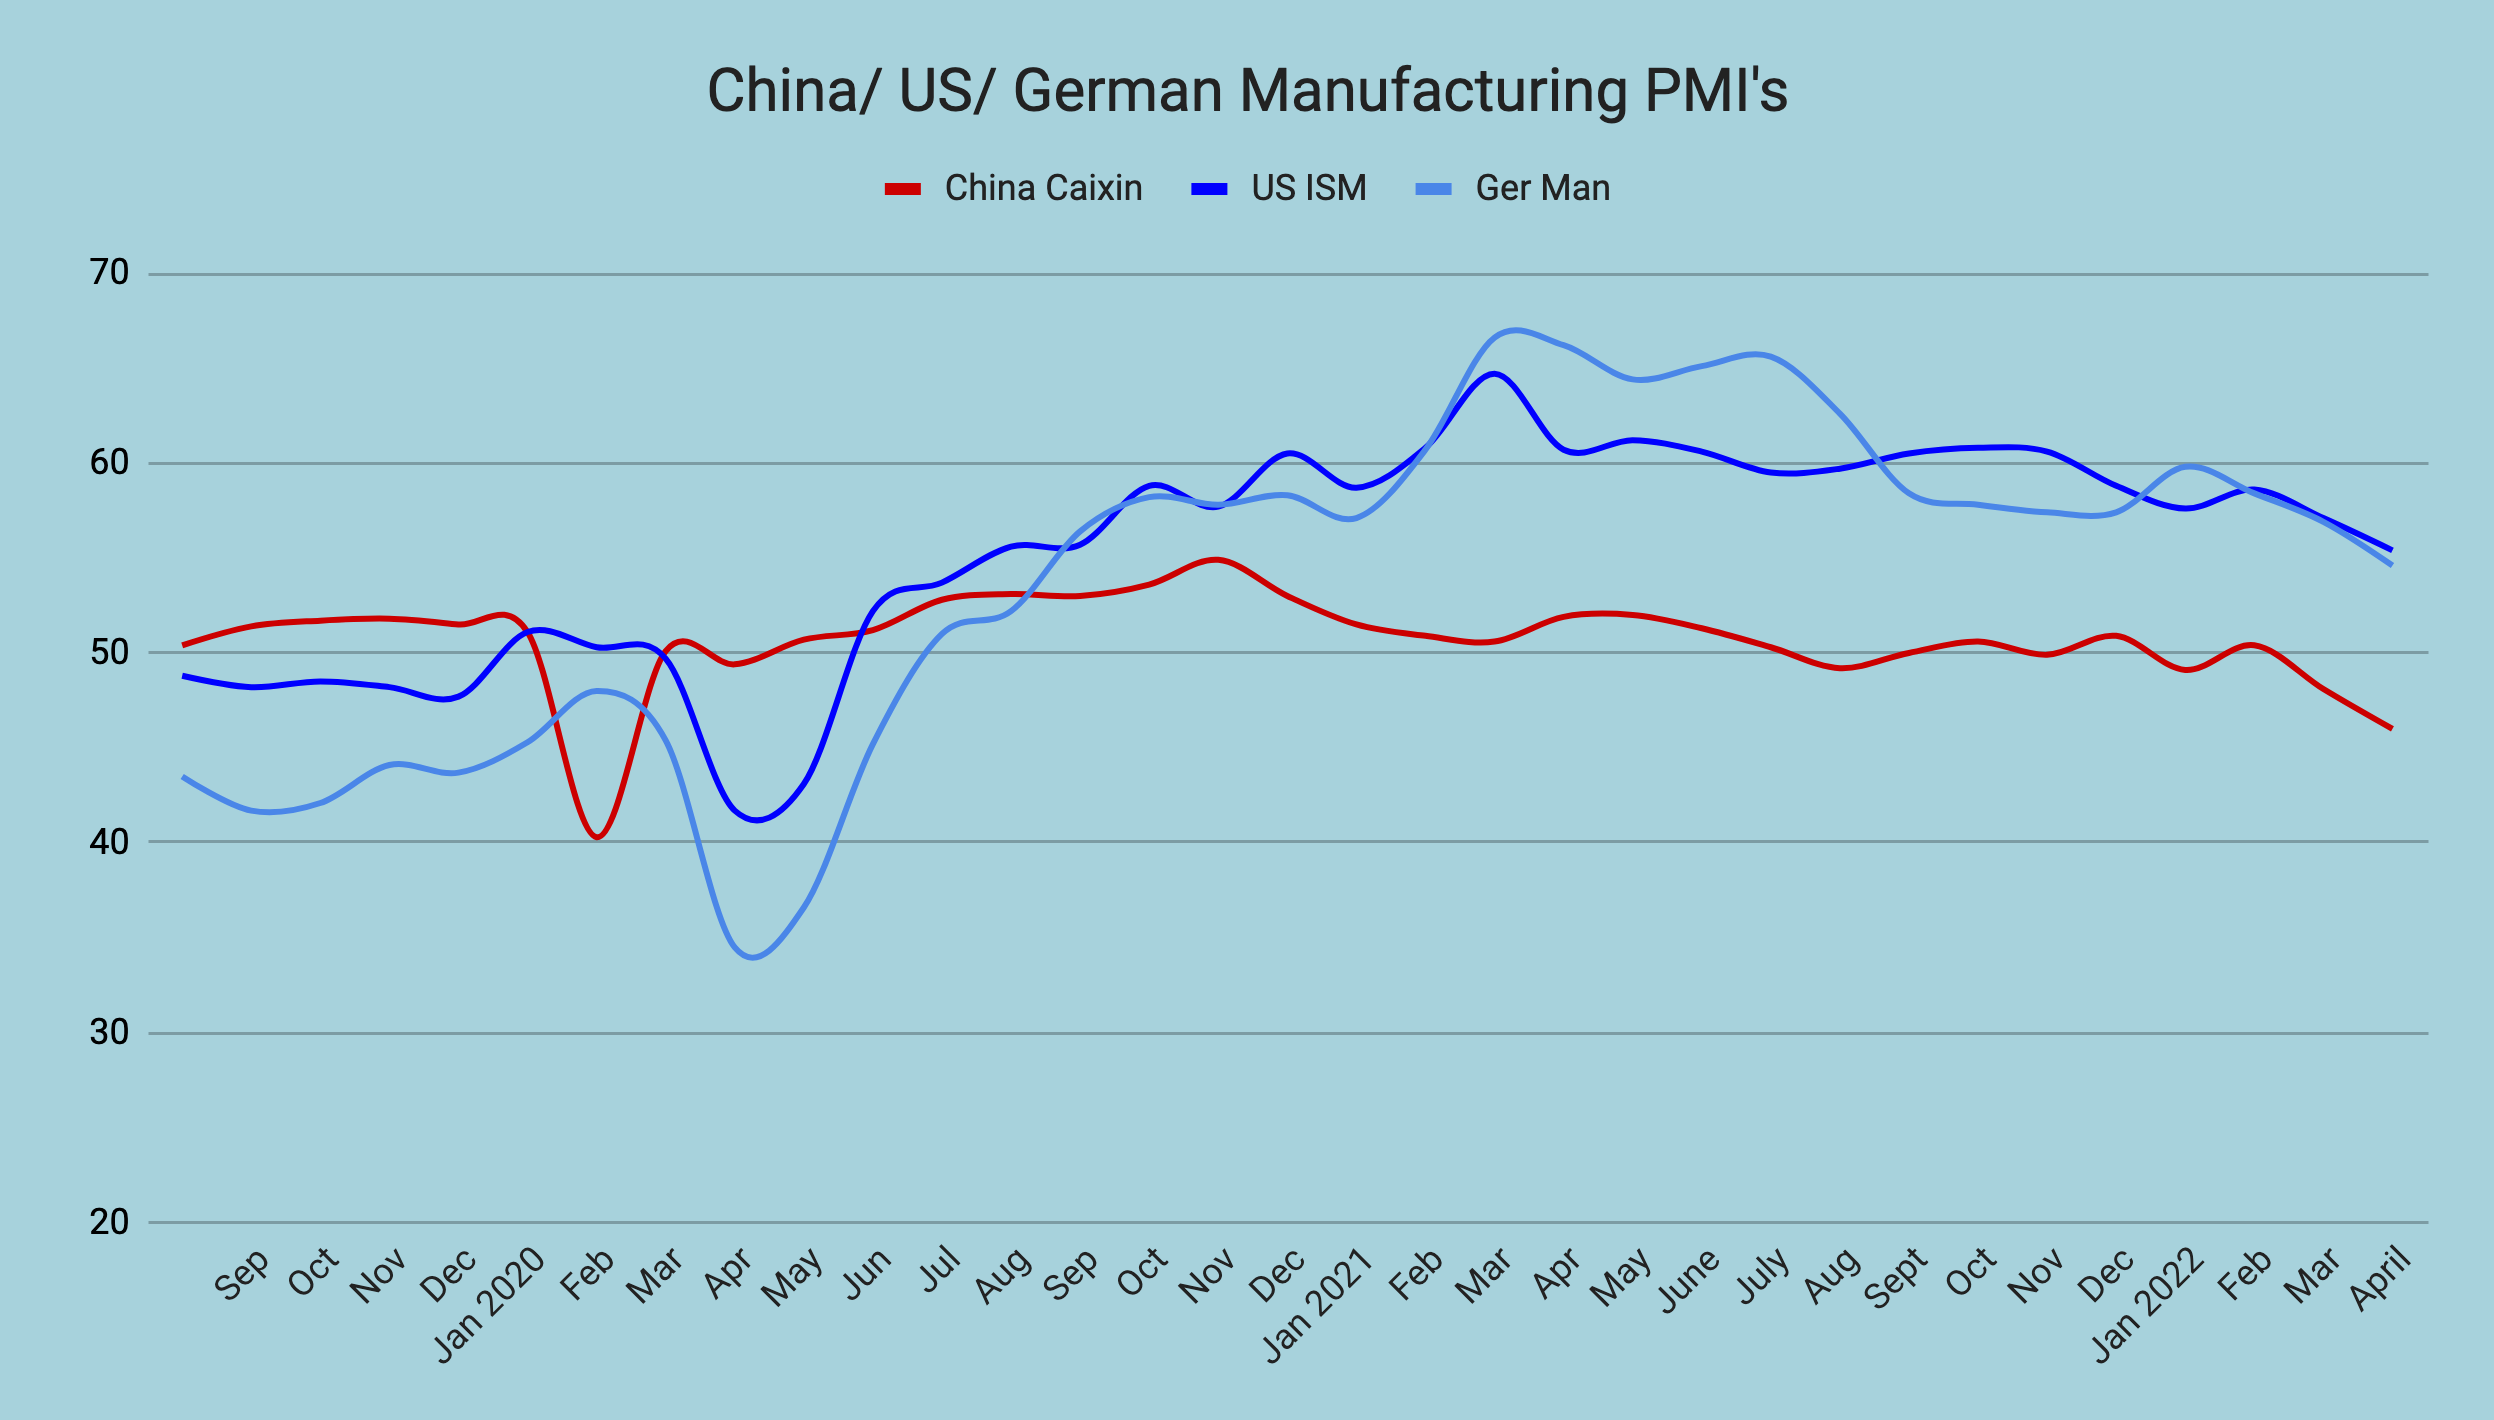
The main PMI’s are not looking pretty, with China already in contraction, and as China leads the global economy, expectation should be that the other PMI’s are going to follow:
Equities:
The orderly sell-off continues. Due to the lack of extreme down days, US indices are only just becoming extended to the downside despite posting seven weekly declines in a row. If there is a sprint lower (likely around any poor productivity data this week), the US S&P offers value for long term investors (5+ years) even if there is a further 20%+ decline later this year.
However, the lack of selling so far in other indices and continued weakness of intermarket signals makes it unlikely that long term lows are being put in on this bounce (again, if it comes….).
FX:
Despite continued equity weakness, USD was down last week - the first uncorrelated week v’s equities for a while. This could be a hint that a relief rally in equities is about to come.
However, many pairs were at key areas v’s USD so without a new catalyst a first bounce was all but guaranteed.
GBPUSD monthly pinging off long term liquidity:

Still another week and a bit to go in May trading though; whether these early bounces v’s USD can hold will likely dictate the direction of drift in summer trading.
Precious Metals:
Gold and silver have made a cursory bounce off key areas. It would be preferable to see some capitulation before getting interested again.
Gold (black) v’s TLT (orange); hmmmm :

Trades Update
This has moved to a free Wednesday trades record, also available (most weeks) on Substack:

Risk Index
Under 50 = bullish, over 70 = bearish, over 90 = potential correction within 6 months
Note that the current correction (or bear market….?) was signalled 8 months ago so the expectation is that the Risk Index will become increasingly bullish the longer this move down lasts.
1-year lookback:
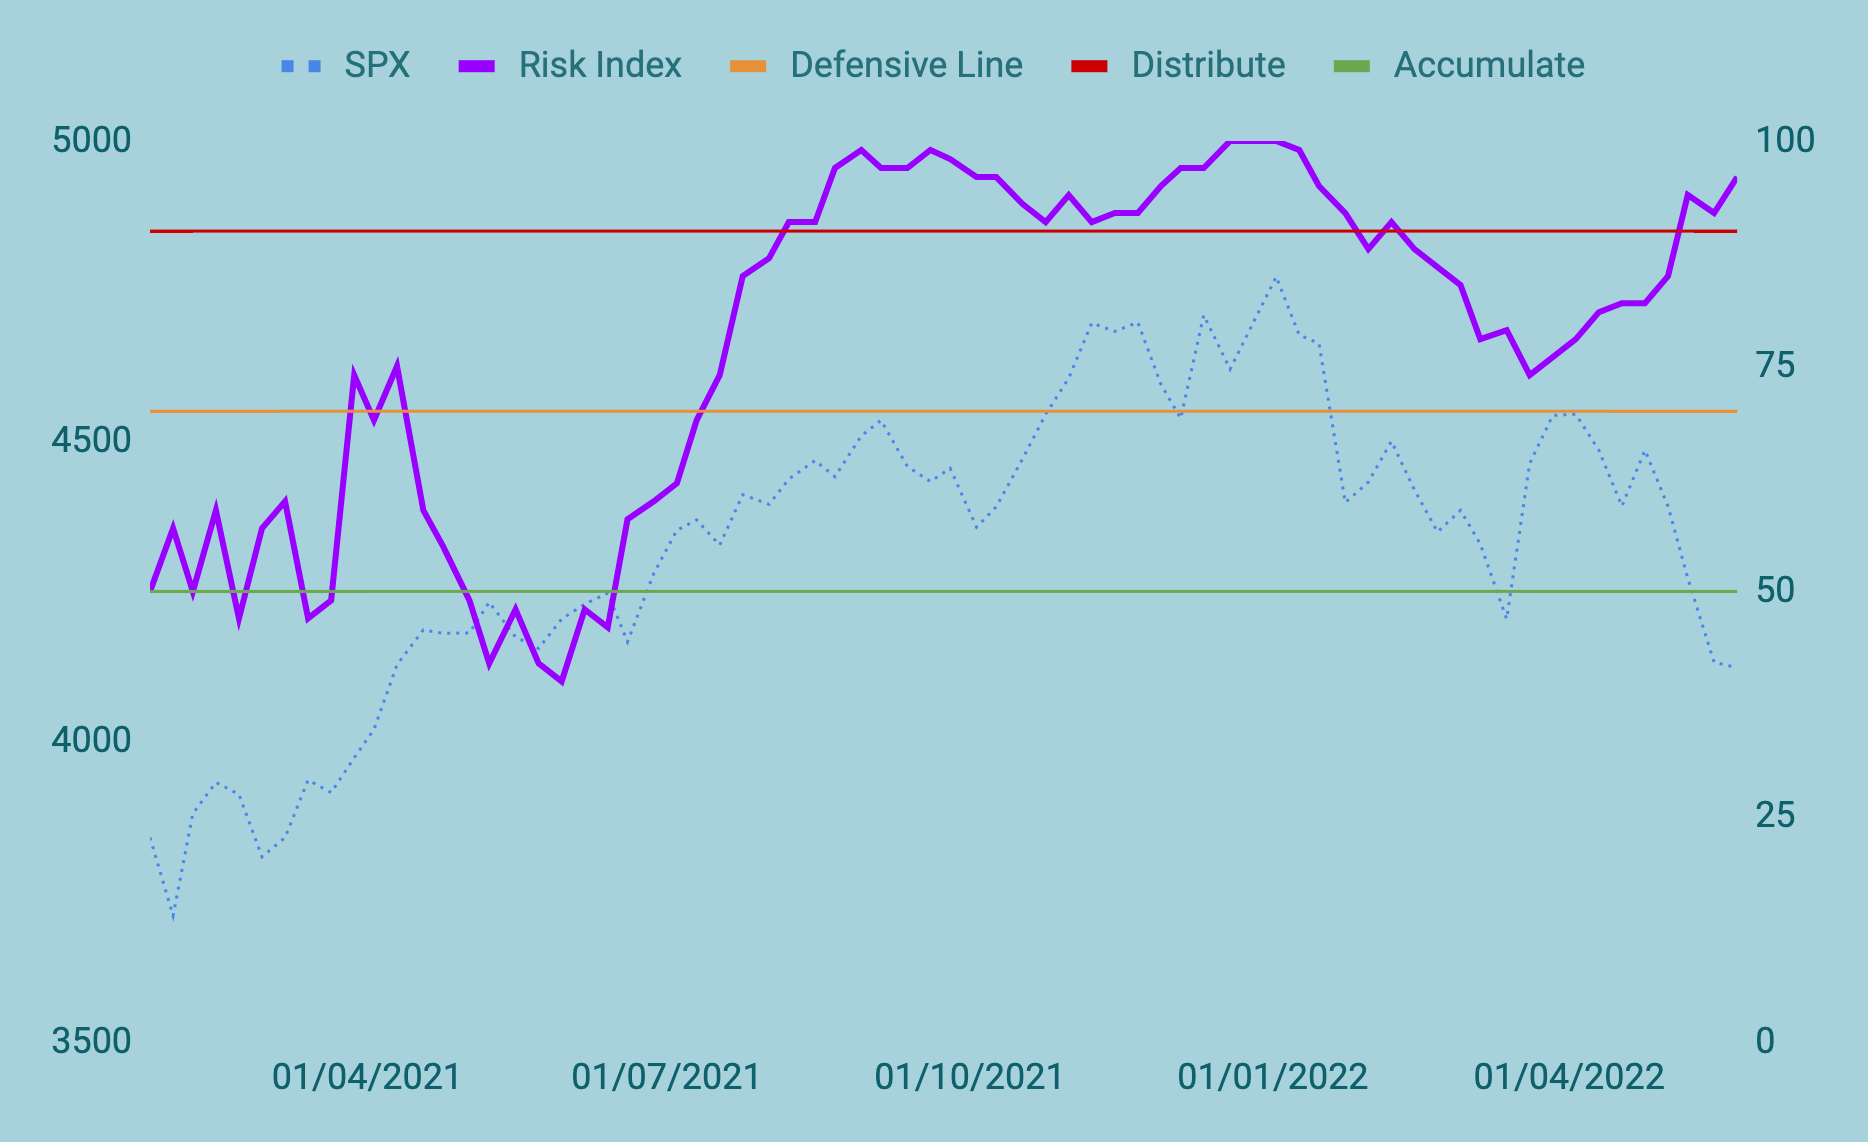
The Risk Index is pointing towards prolonged weakness into year end, even if there is a sizeable bounce in equities over the summer months.
Themes to Watch
Keep reading with a 7-day free trial
Subscribe to Risk Index to keep reading this post and get 7 days of free access to the full post archives.