


Matthew Firestone and his horse, The Optimist, 1983
In this issue
Market breadth
Timing a short
The yield conundrum
Risk Index

Under 50 = accumulate, over 70 = defensive, over 90 = distribute
The Risk Index is a combined read of the trends of 68 intermarket spreads and indicators, from credit spreads in the US to car sales in Spain.
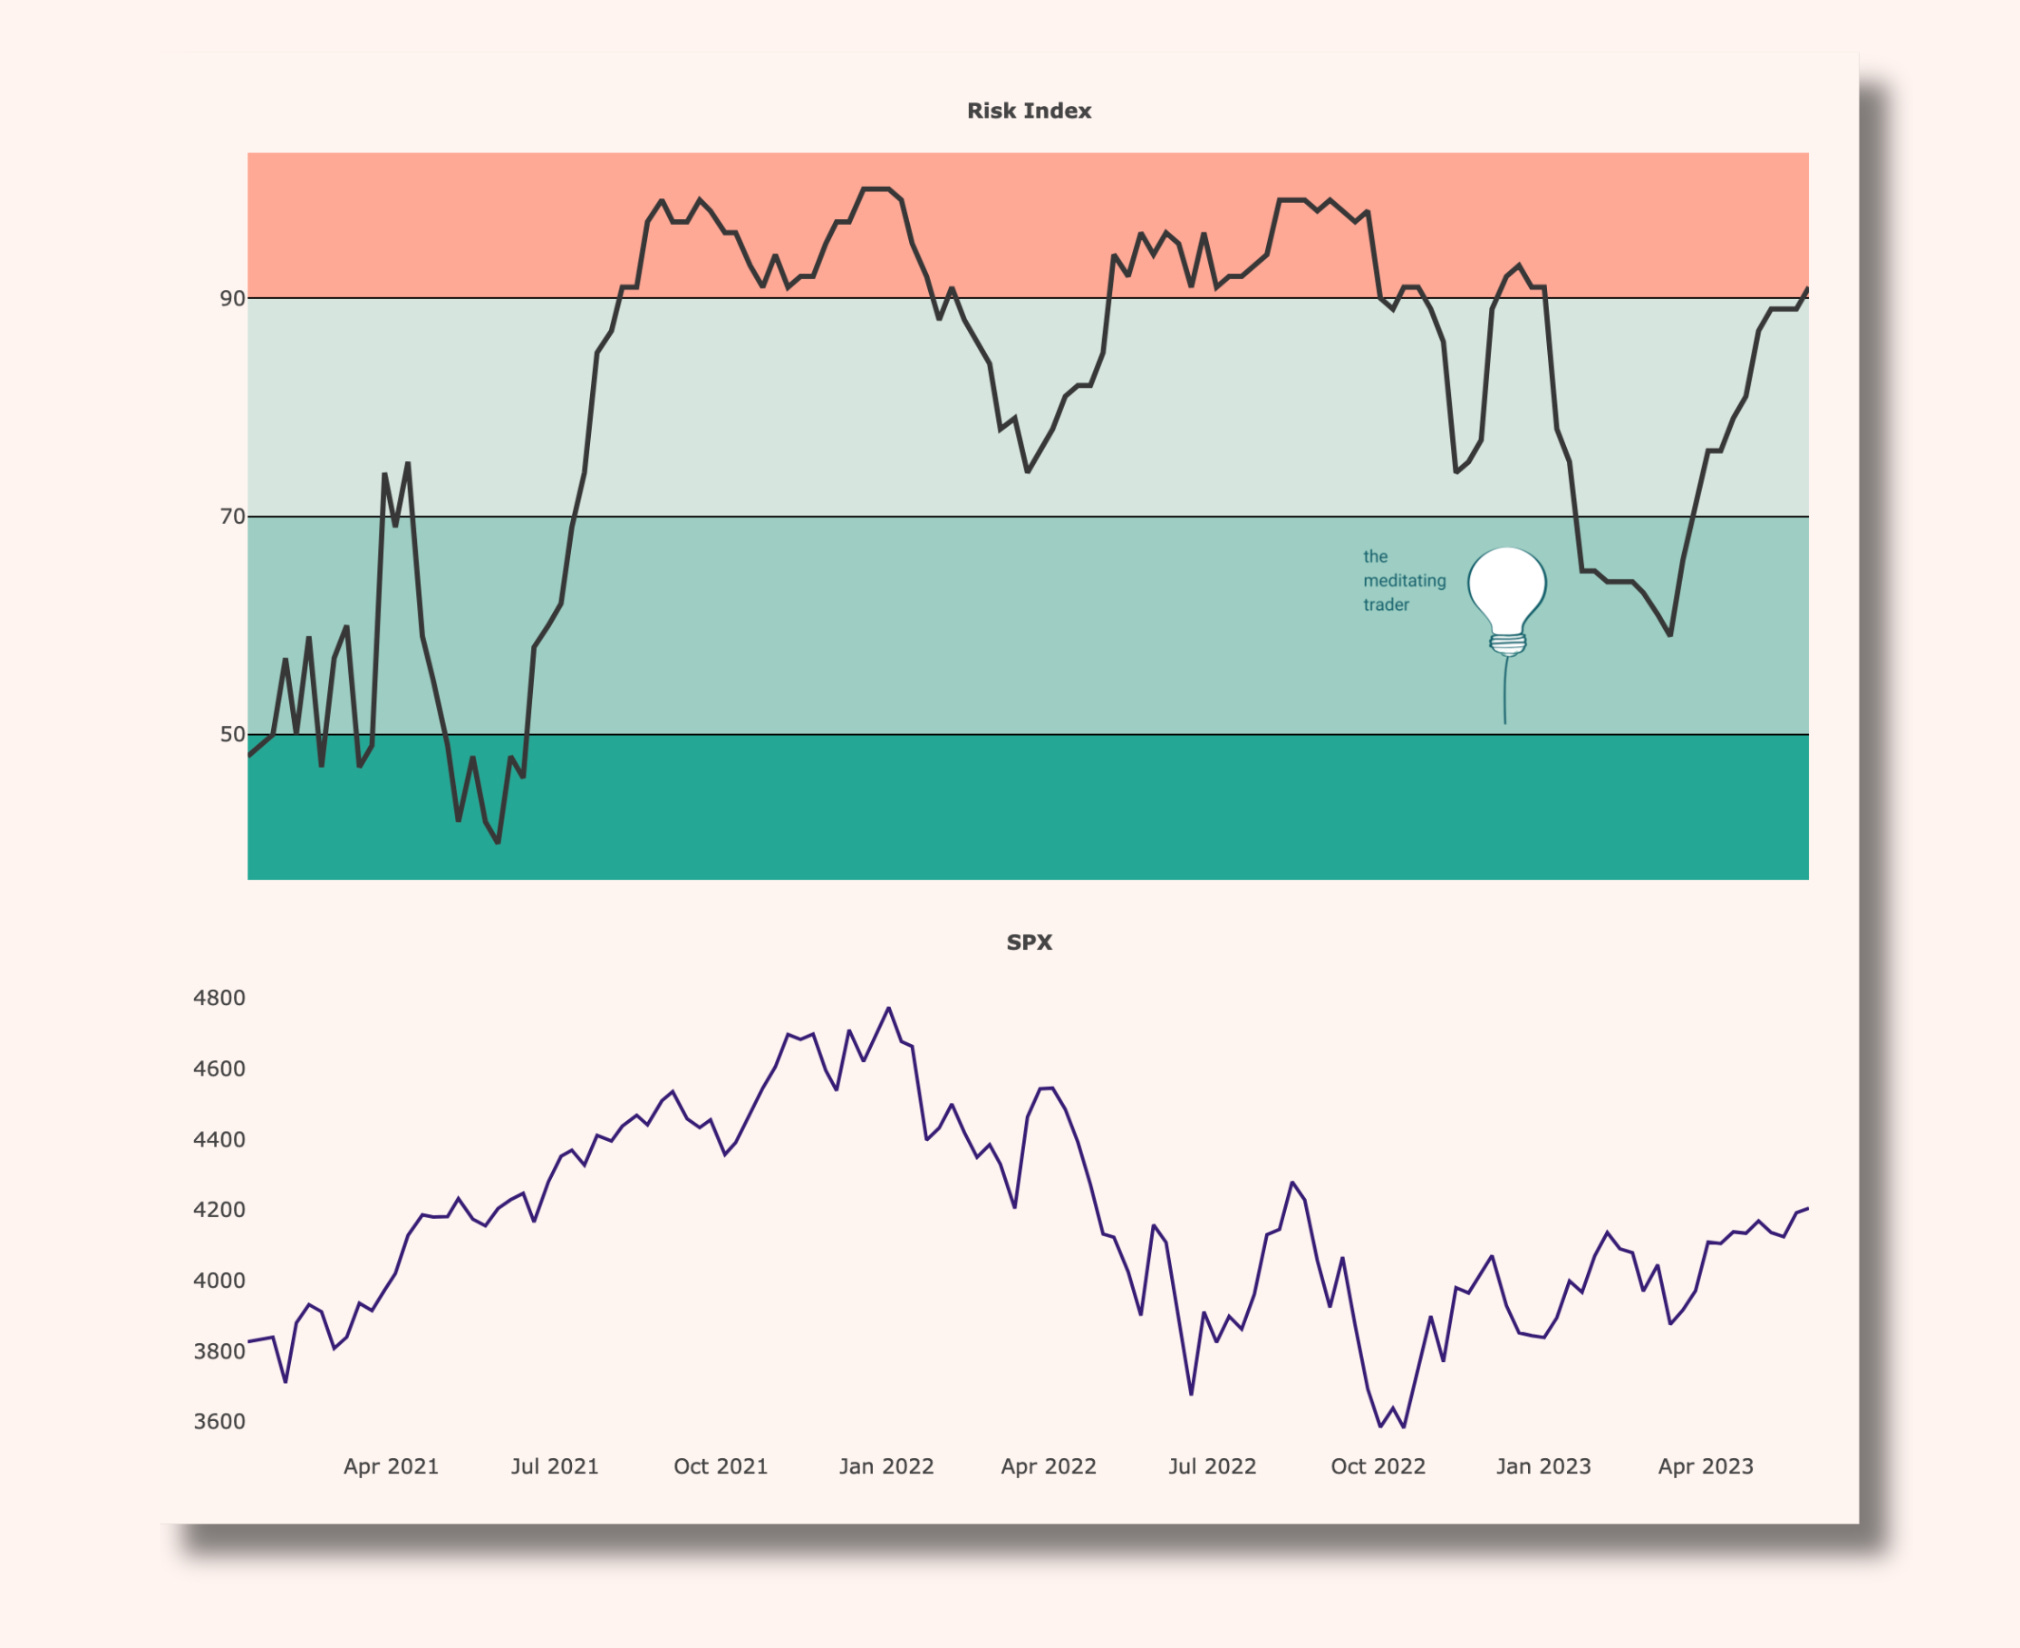
The Risk Index kicked into a territory that historically means it is highly likely there will be a 20% drawdown in the S&P (and equivalent panic elsewhere) within the next 6 months. The last time it went from a green zone (sub-70) to red, the bear market started 4 months later.
In a way, this time is different as we aren’t (yet) seeing the overall excesses we saw in 2020 & 2021 - and we’re not screeching into new all time highs every week. However, all I’m looking at now is getting out of any weak long-term stocks so that there is some cash around to get in when panic starts to roam.
It’s worth mentioning, again, that seasonals point to a grind/ going nowhere routine until September. So, to express a bearish viewpoint I would wait until significant extremes or look to take advantage of some early weakness in commodity currencies.
Any key inputs?
Wednesday & Thursday - European CPI figures
Thursday - 1st June - debt ceiling idiocy over for another few years….?
Fri - NFP
I mentioned last week that positive debt ceiling news would setup Nasdaq for a fade, and that plus AI headlines (are we about to head into an AI bubble-within-a-bubble?) has certainly pushed the Nasdaq into extremes at least on the daily timeframe.
However, given the lack of extension in other markets I would caution shorting this immediately. We could see some silly gaps higher over the next week or so.
The dynamic of headlines moving to be predominantly positive and driving price higher is an important one to look for when reading market sentiment. I’m going to dive into it in Trader Diary tomorrow -

Market breadth is not a timer
Market breadth continues to be a joke. Take out around 8 stocks and the US markets would have had a nasty week.

A grid of all stocks on Finviz: green for those that were up over the last week.
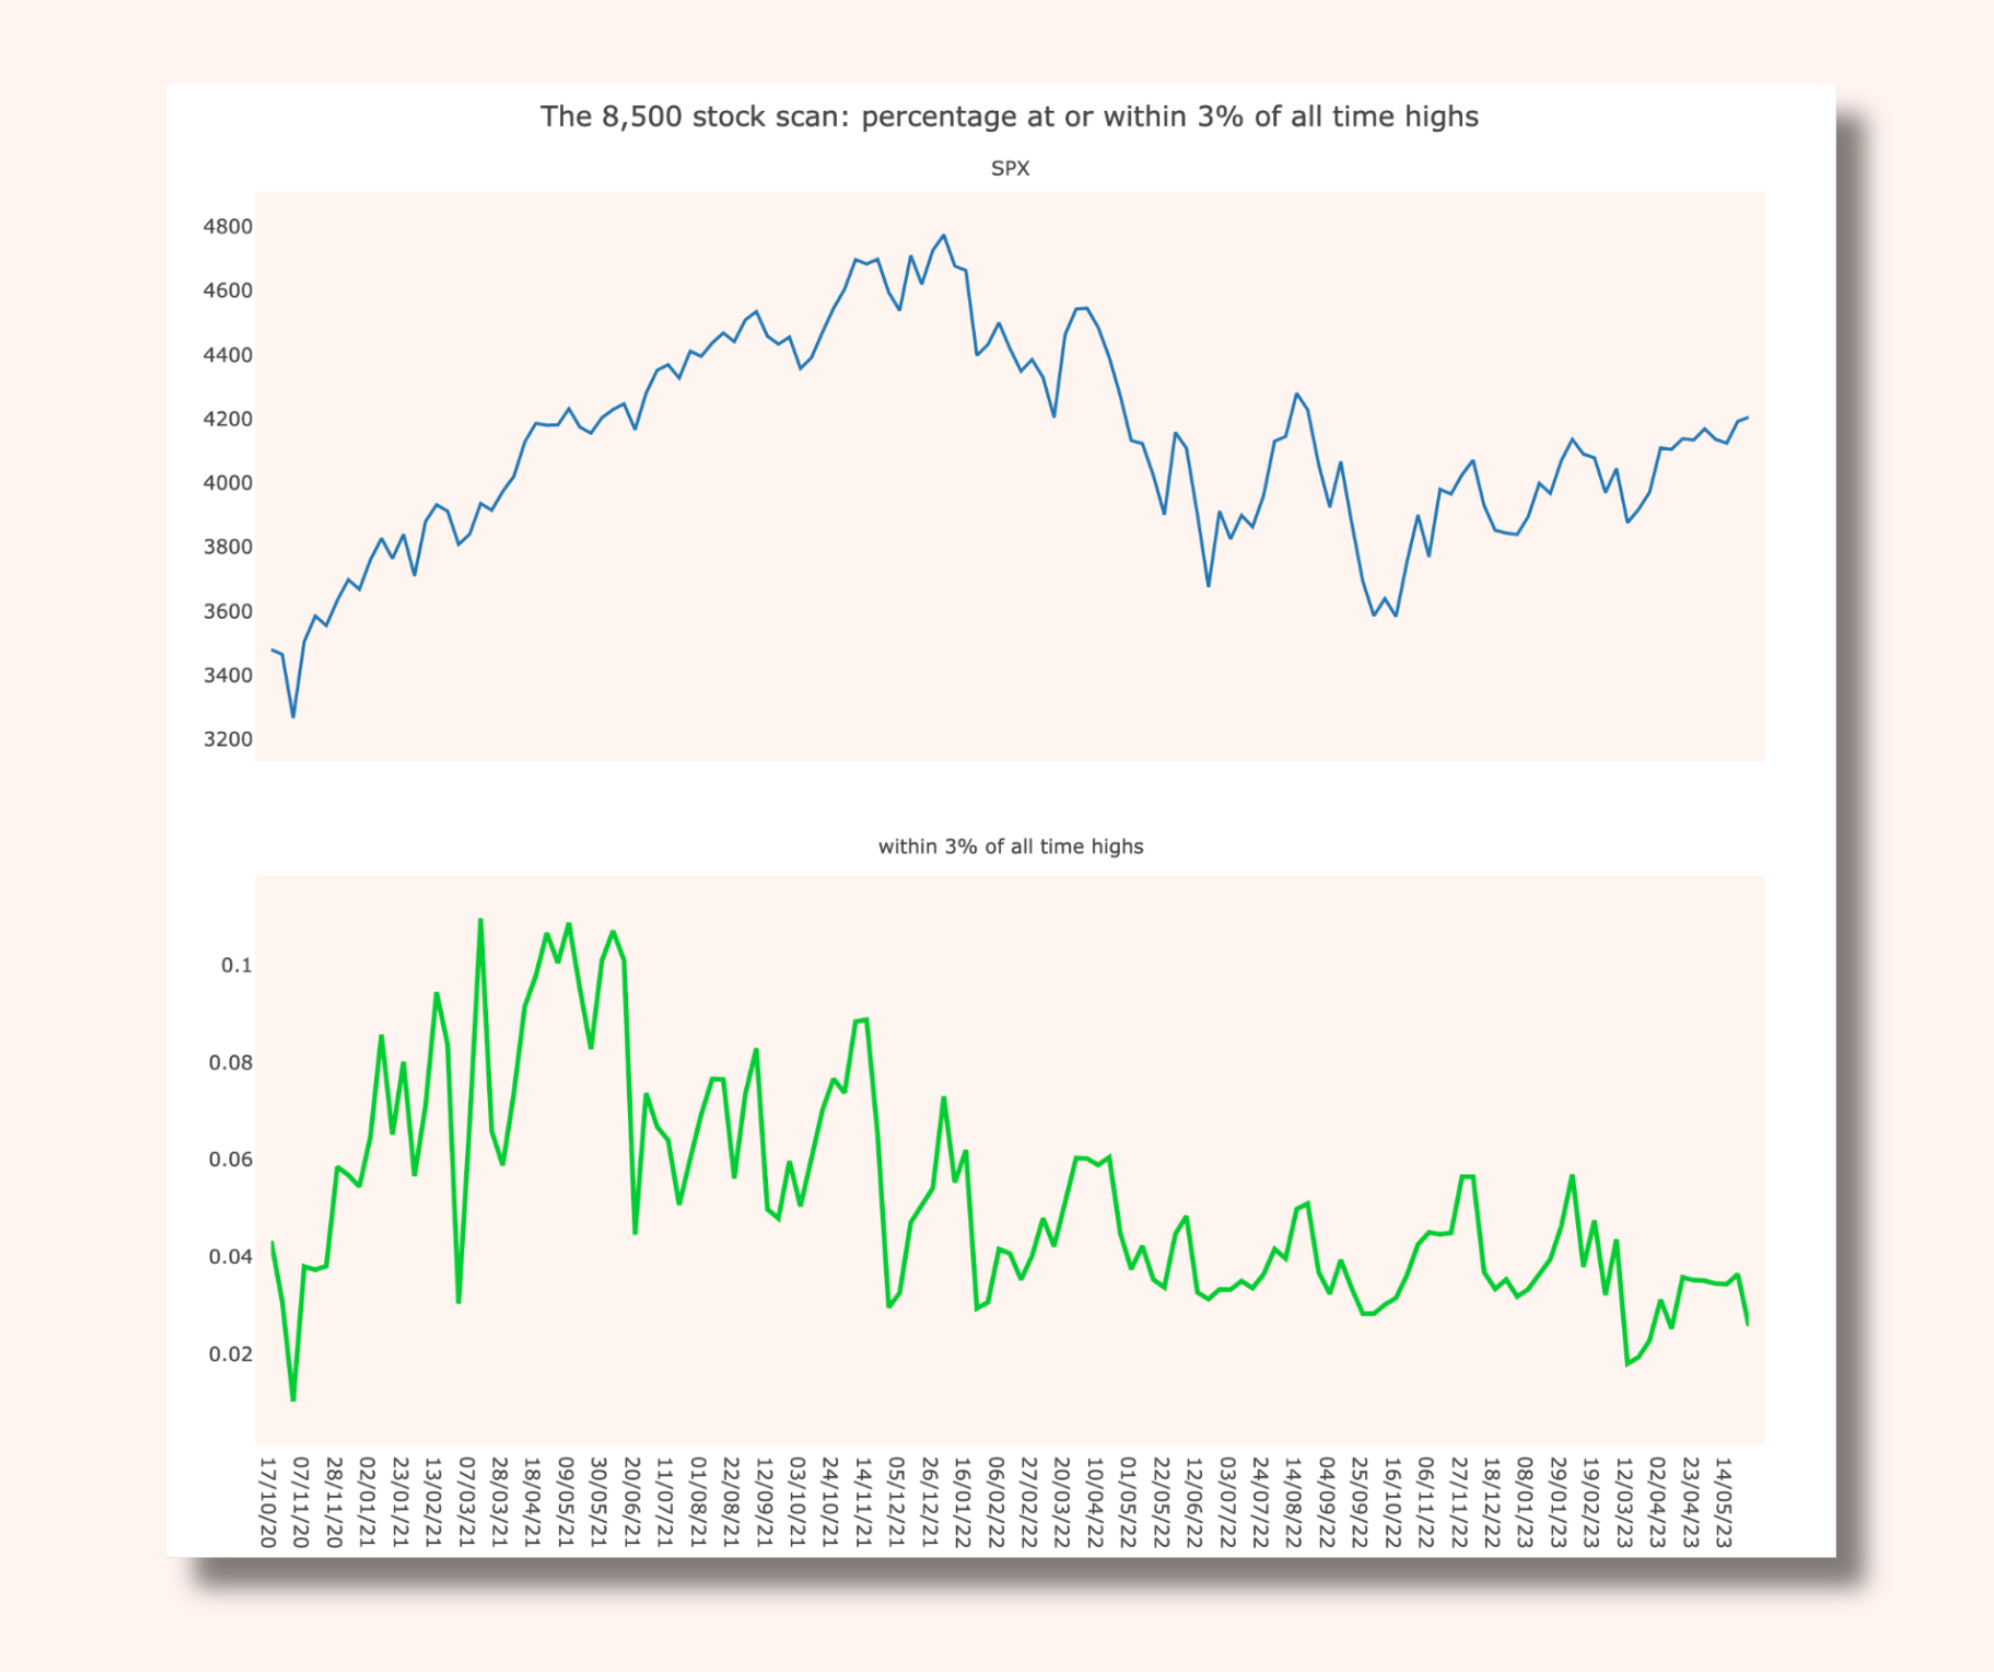
A different look at the Finviz stocks, this time showing stocks within 3% of their all time highs. Closing down this week, despite the S&P closing up again.
So, breadth is not in any way confirming market strength. However, this is not a good timer for shorting. Trillions are run by money managers who need to have the majority of their money in stocks. This fuels imbalances as they push money into the ‘safest’ stocks, increasing those stocks’ weighting in the indices and giving equities the appearance of strength.
Once this imbalance becomes too large, there are no more buyers and it’s time for a reset.
Many a penny has been lost trying to top-tick that turn too early.
FX telling us the real story
I noted a few months ago that commodity currencies were starting to look weak, and this was not a good long-term sign for the health of the market.
This continues to be the case.
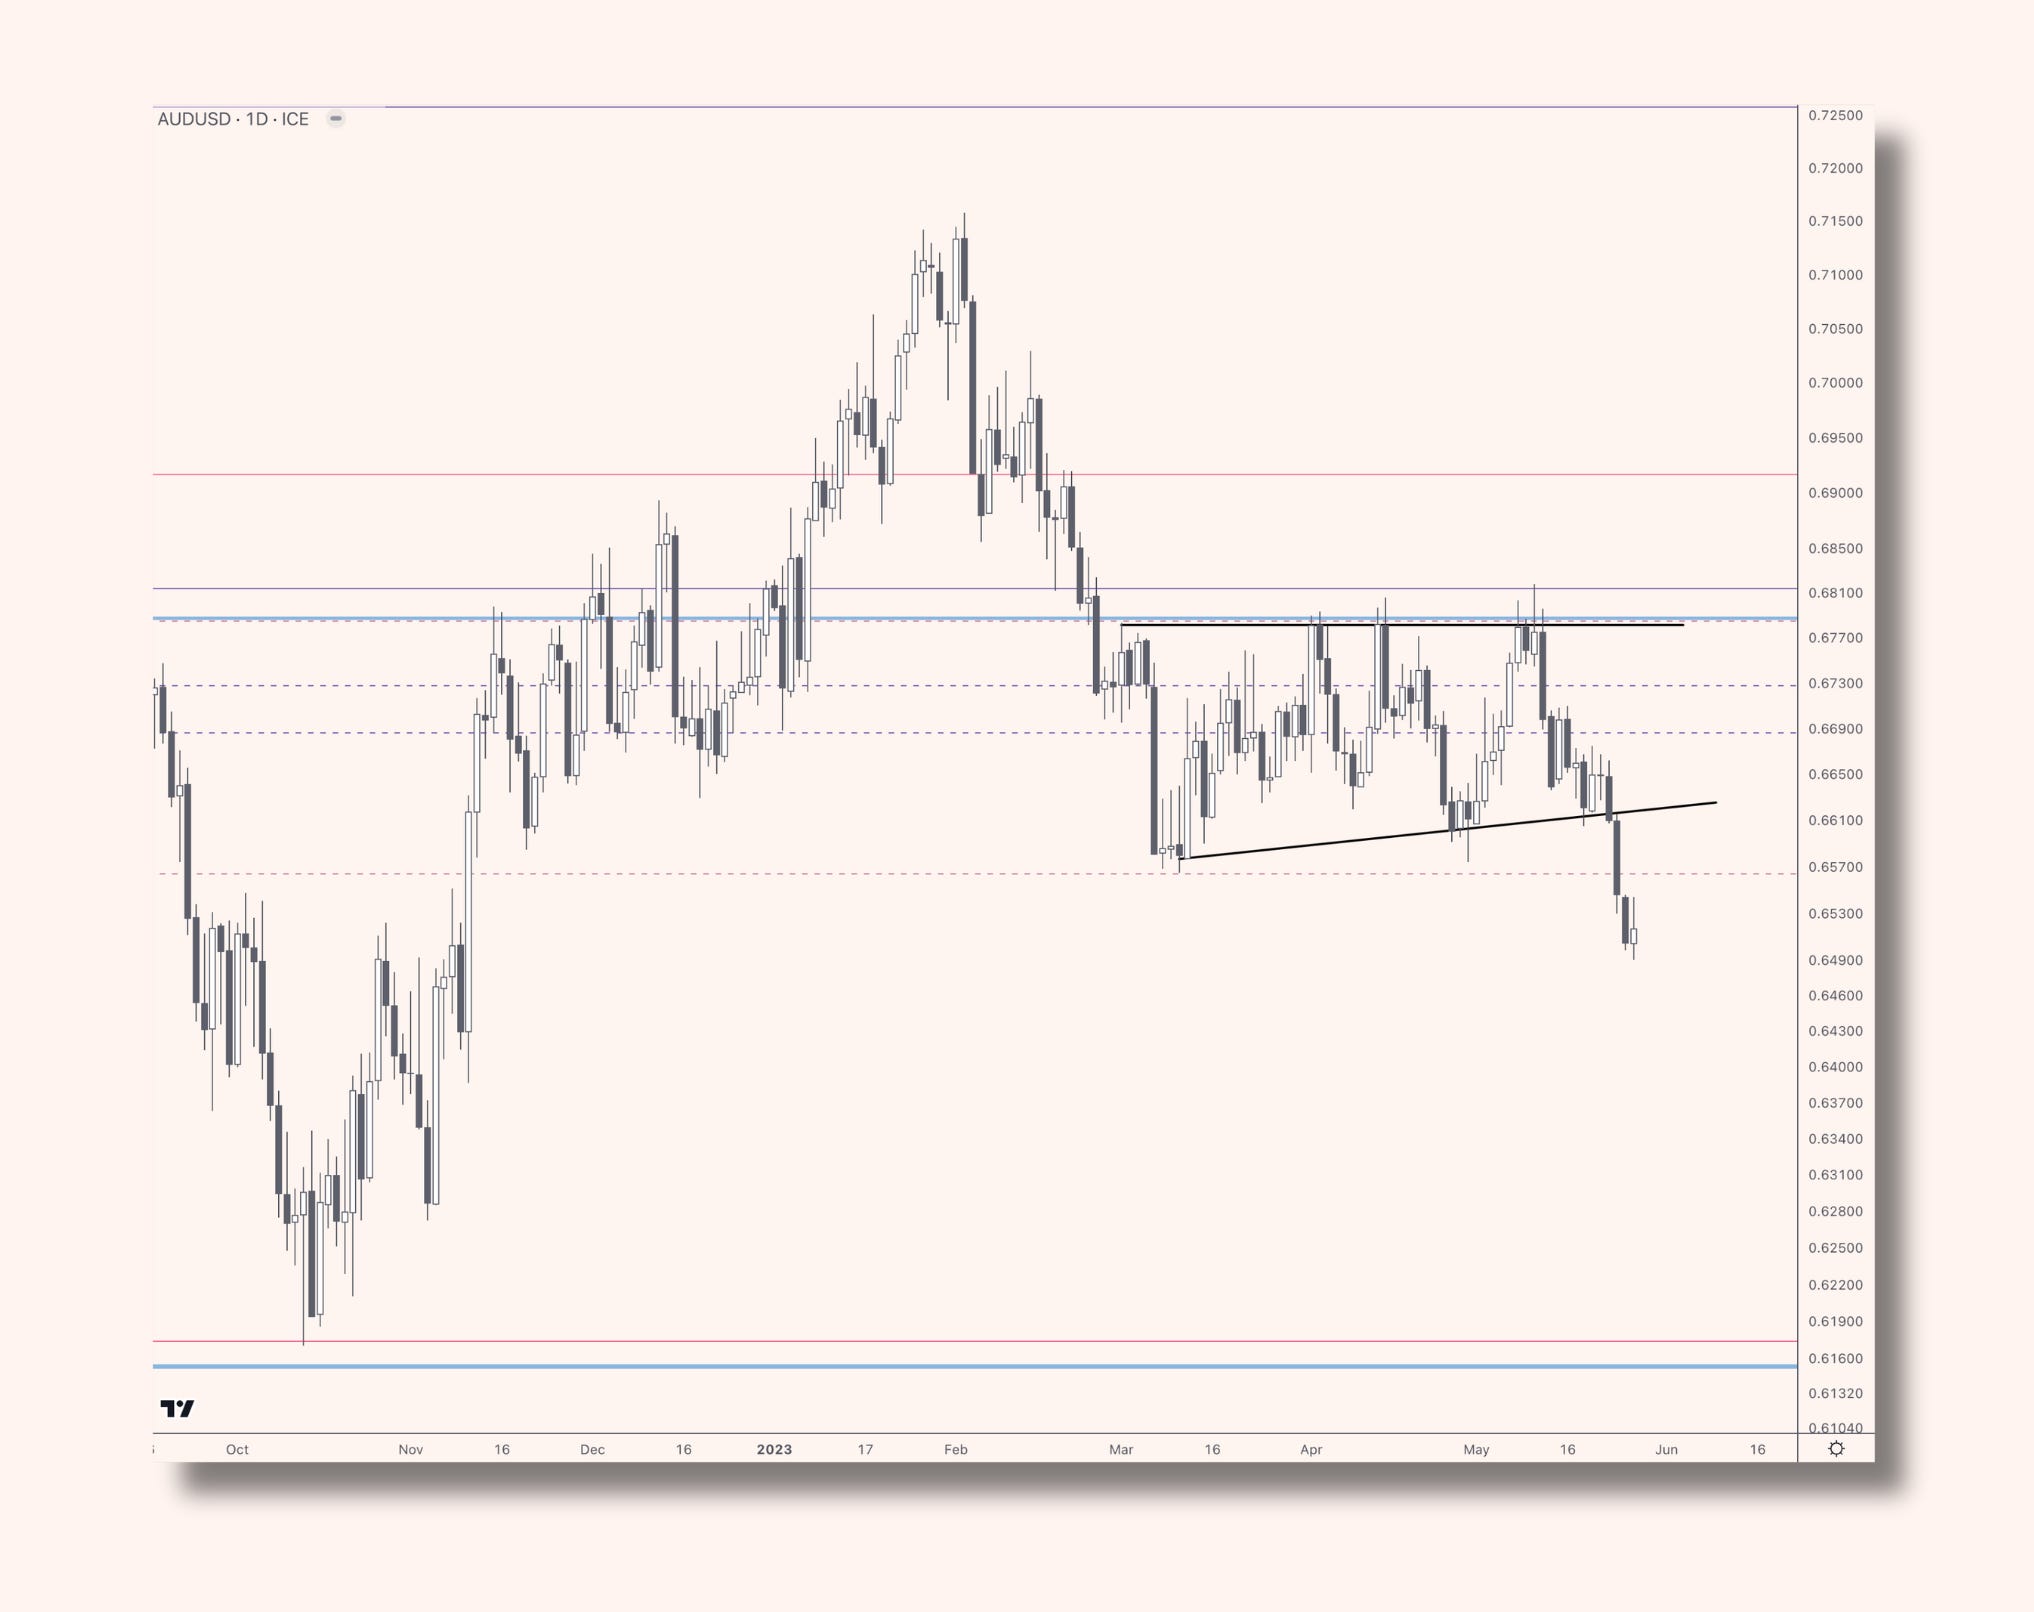
AUDUSD daily - breaking down last week. Could see a bounce now, but after that there’s a decent range to fall through.

NZDUSD daily - same story.

And this is confirmed with continued weakness in commodities (copper weekly here). There were a few headlines about disappoinment in China data and an expected re-opening trade. If that was really going to be the case, why had copper topped out in February….? Oil similar - can’t even hold a gap up on news that the Saudis are trying to restrict the market.
Copper rallied a bit last week and there may be a bounce ahead alongside some reprieve for commodity currencies. But there was no volume at the lows - likely this heads lower before the year is out.

USDCAD weekly - CAD hadn’t even managed to rally much against USD when other currencies were. I’m keeping an eye on this consolidation and if there is some weakness in USD over the coming weeks, bringing this down to the bottom of the range, I’ll look to jump on, expecting a breakout higher alongside market weakness later this year.
The commodity picture, therefore, agrees with my view that this wave of inflation is behind us, it just takes a while for it to show in the data. The Risk Index agrees too, in that the reason inflation is behind us is that Central Banks have already killed economic growth with their tightening, and this is showing in Risk Index indicators. I’m not bothered that equities are holding up - when they agree with this outlook, the trade will be done.
However, short-term yields are still moving higher. This doesn't tally with my outlook. It means that the market thinks Central Banks have a few more raises in them. That means economic data is still strong - it has to be to justify this.

UK 3 months yields - telling us it expects further raises from the BoE.
This is contributing to another weakening of JPY, a trend that will reverse when the clouds of economic weakness appear more clearly on the horizon.
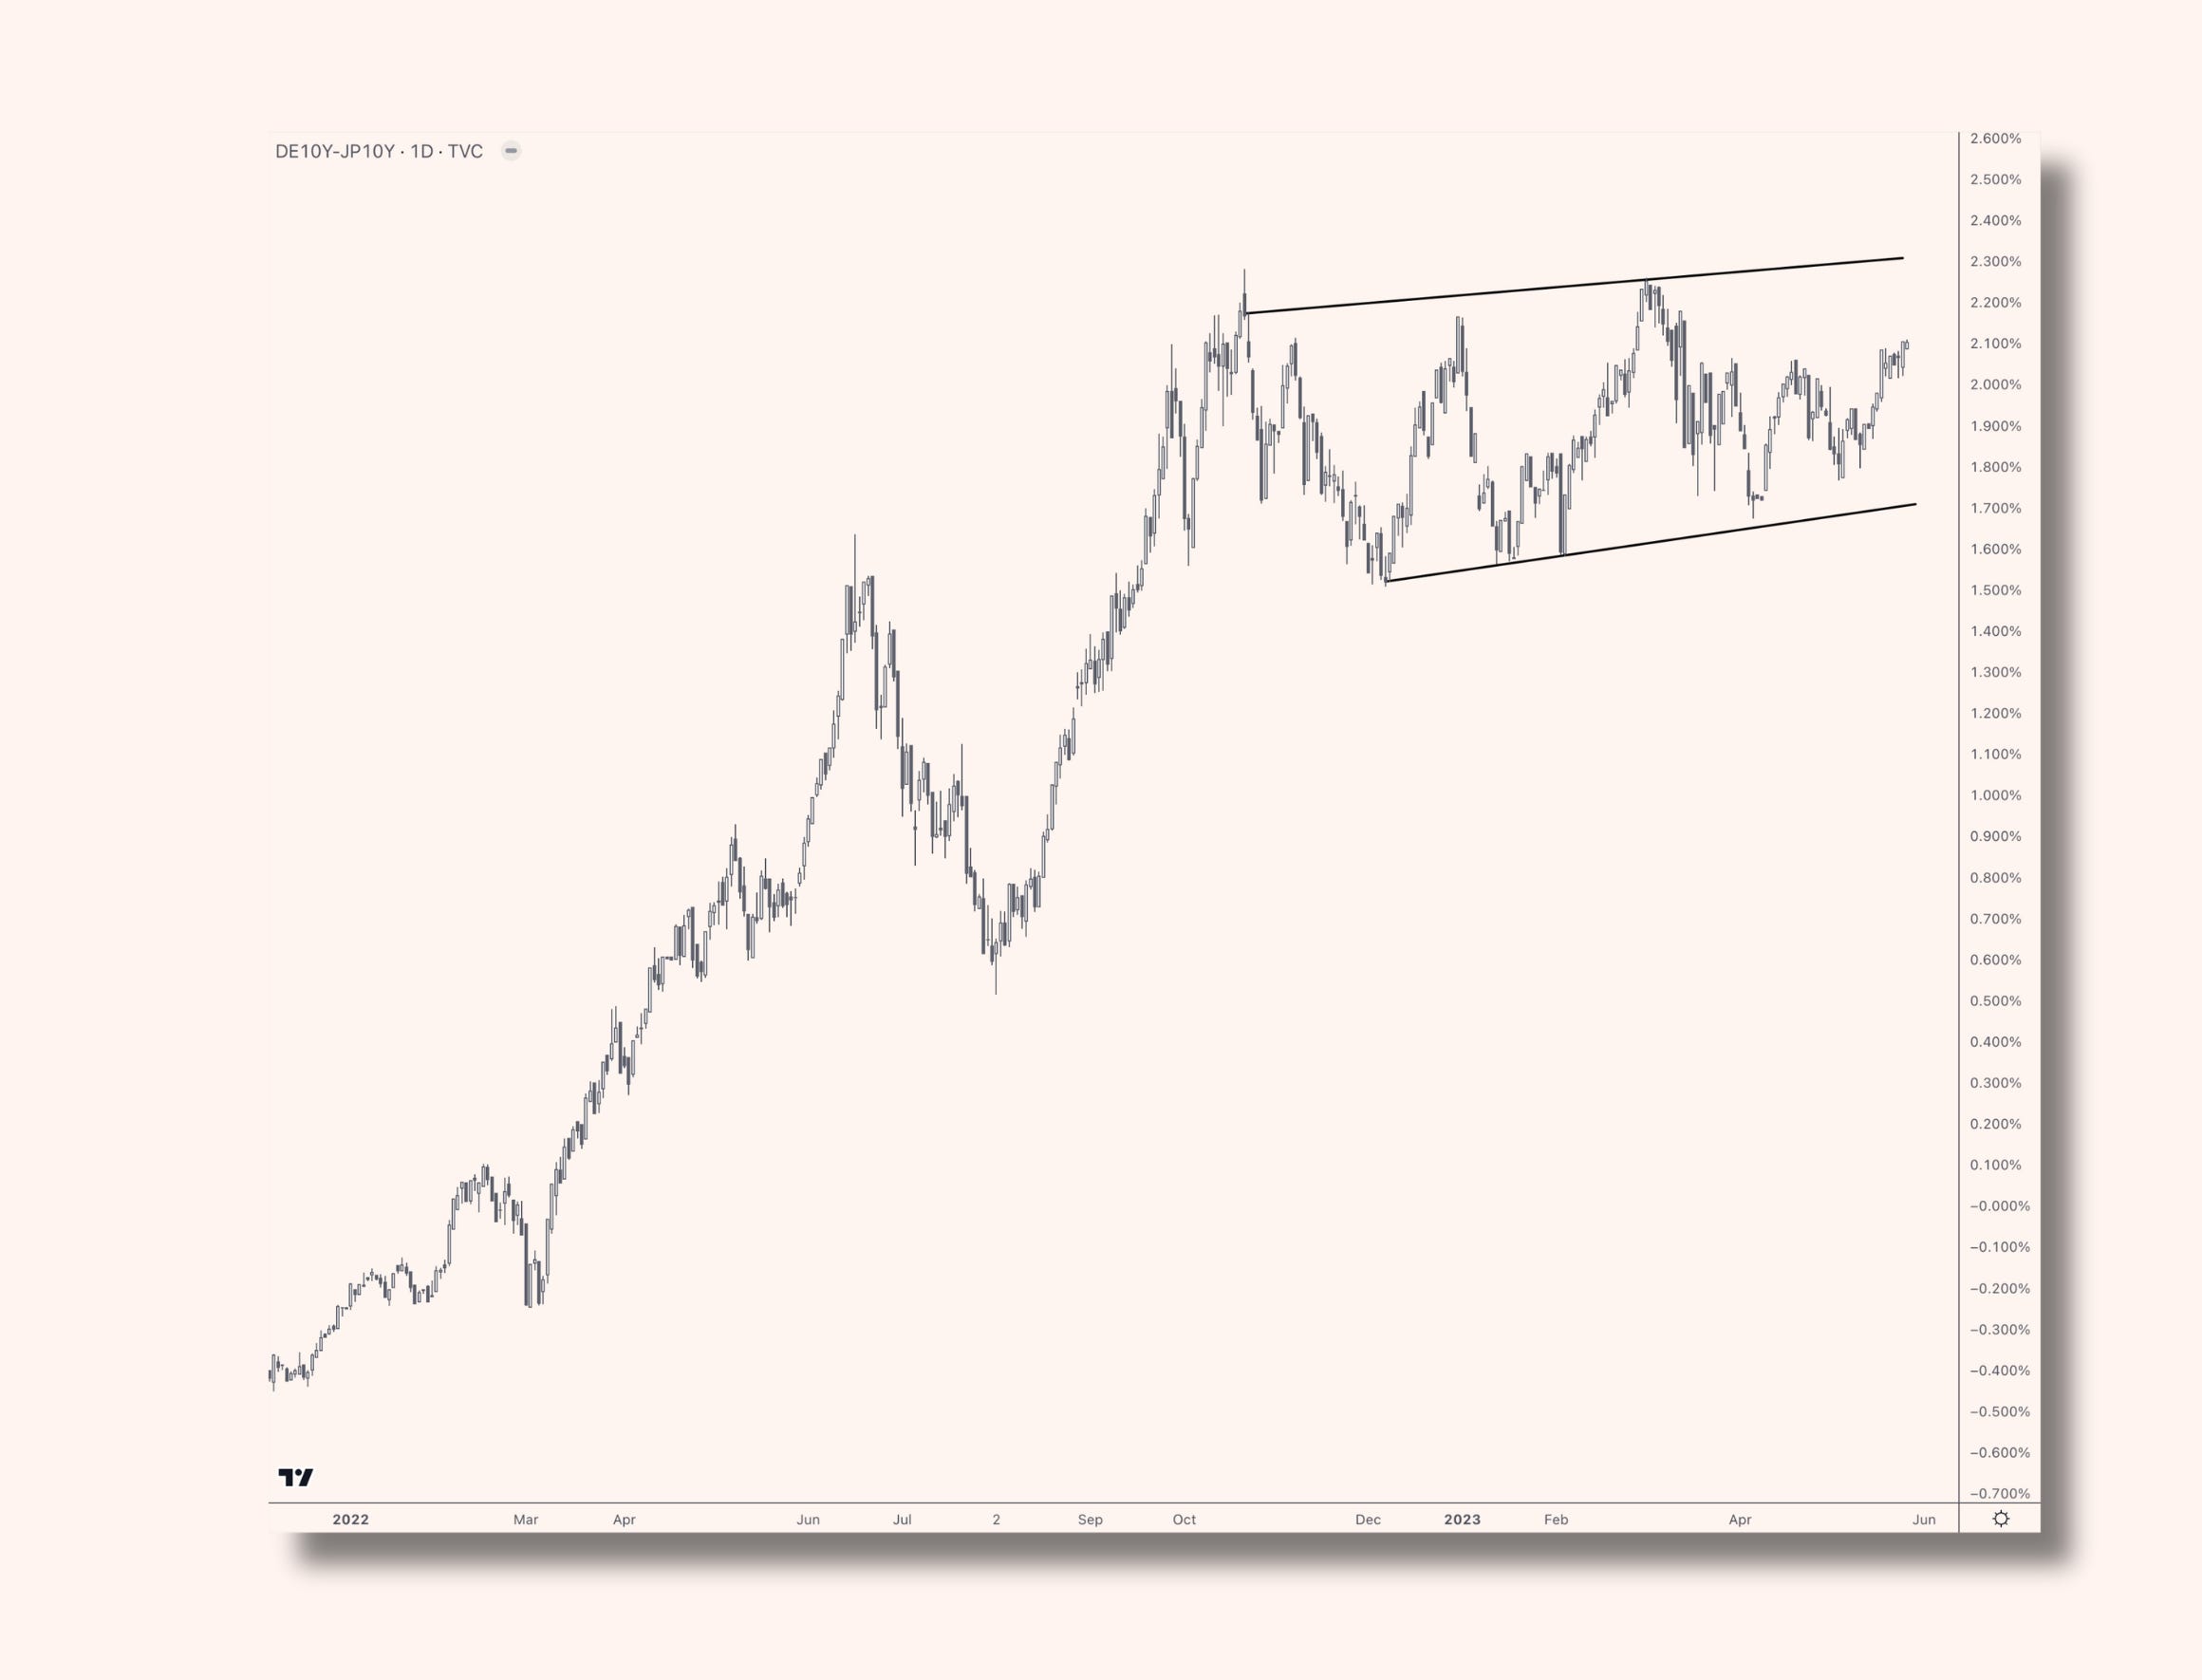
German - Japanese 10Y yields - grinding higher again, and bringing EURJPY with it- same as most currencies v JPY.
With European inflation data in this week alongside US employment data, let’s keep an eye out for any tops in these yields, setting up long JPY trades and building evidence that a medium-term equity top is here.
Quote to Self
"Great investment opportunities come around when excellent companies are surrounded by unusual circumstances that cause the stock to be misappraised."
~ Warren Buffett ~
I would contend that the last time this happened was in March 2020. It has not happened since, so the idea that this bear market has run its course is misplaced.
Have a great week.
