
Dr Whipsaw


An early episode of Dr Who?
NASA Engine Display in the Rocket Operations Building (1968)
There were plenty of mixed signals last week:
Fed speakers coming in and trying to whipsaw the market’s read of Powell’s presser (‘we’re at neutral’ seeming to indicate no more hikes).
A bumper NFP
I.e. there were legitimate reasons for the whipsaw market. Yes, Pelosi was playing interference, but as noted midweek (link), this was likely all wax and no wick.
The BTP/Bunds spread came in further and supports the idea of some of the fear over Europe coming out of the market and supporting EURUSD long and short USD trades in general.
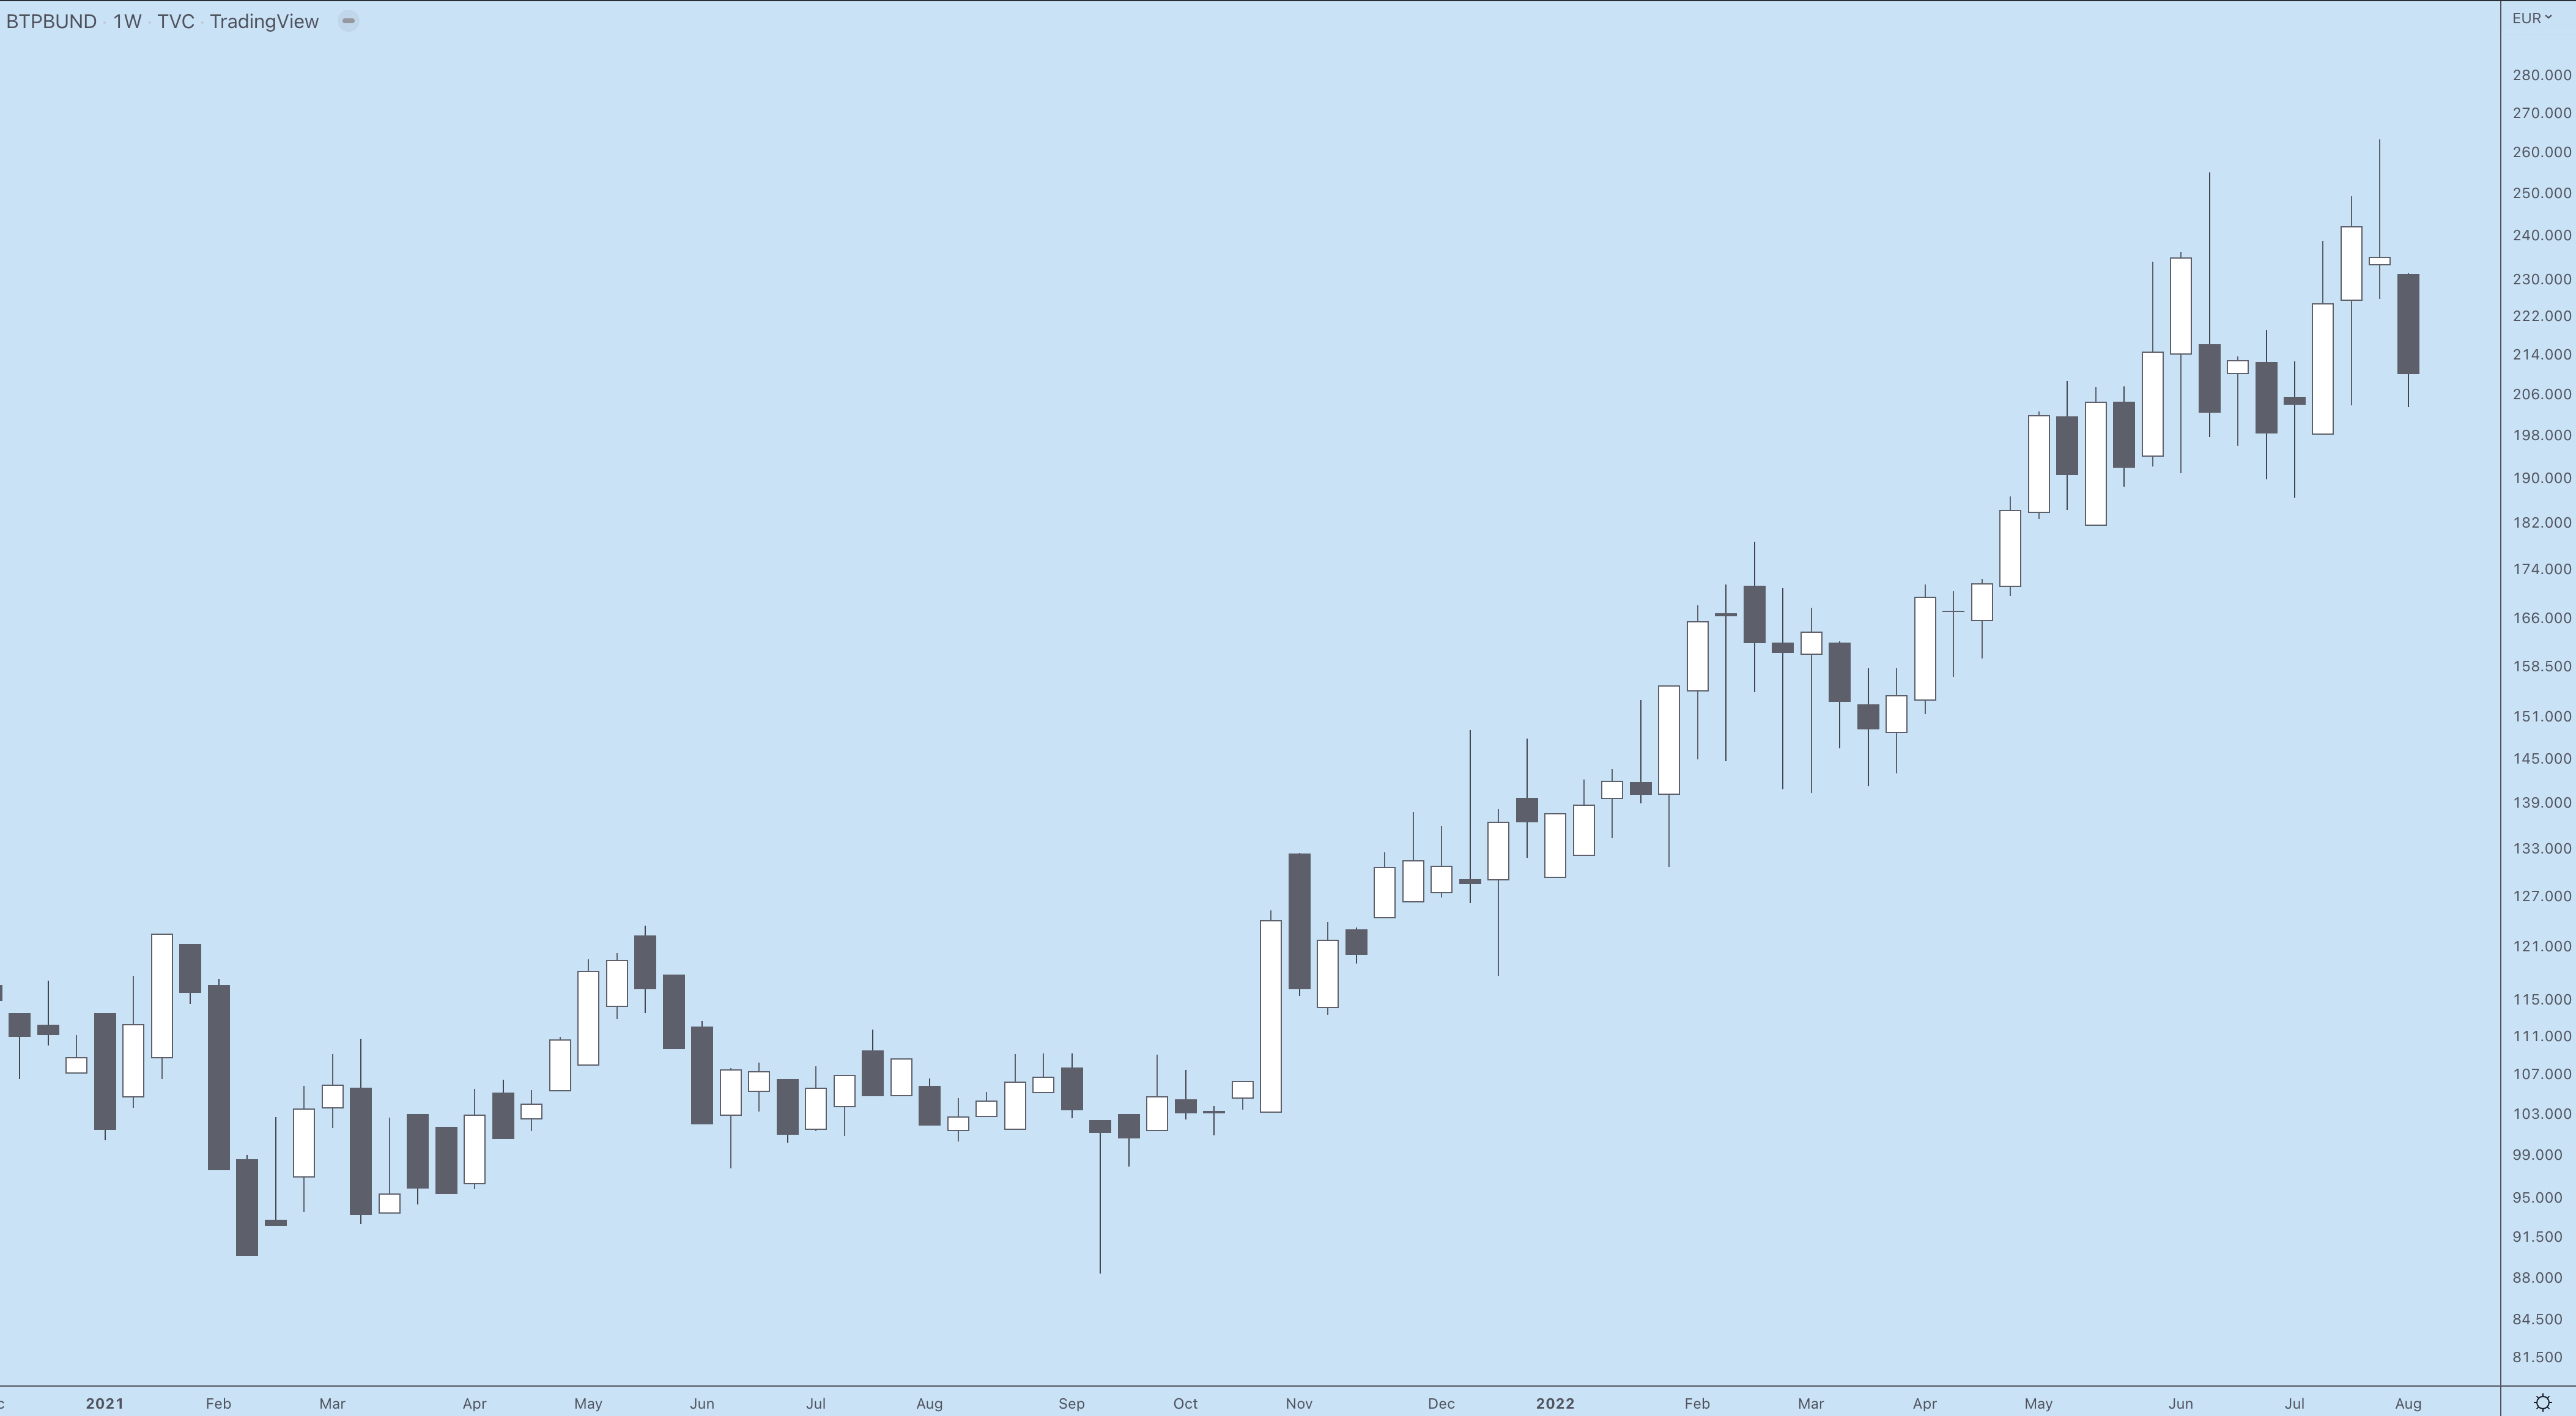
BTP/BUND spread weekly showing the potential topping formation it has been putting in since the equity market started rallying in June.
Alongside watching this in the week ahead, while there was equity weakness on Friday- as discussed further below- strength was shown in much of the corporate bond space.

JNK (top) and SPX (bottom). To the left the bottom in JNK (high yield bonds) can be seen prior to the bottom in SPX, mid June. To the right, the last candle is Friday’s gap down followed by a strong rally into the weekly close for JNK.
If JNK manages to follow through on Friday’s strength, that is a strong sign for equities. I am still in the bear market rally camp and the Risk Index is certainly pointing to weakness into 2023, however:
short term bullishness is the path of least resistance until indicators such as JNK start turning lower again
equity weakness should be defined. With inflation around 9%, SPX could hit new all time highs in nominal terms but be 9% down in inflation adjusted (real) terms. I.e. equity weakness doesn’t have to mean stocks head straight down.
Sunday Twitter Poll
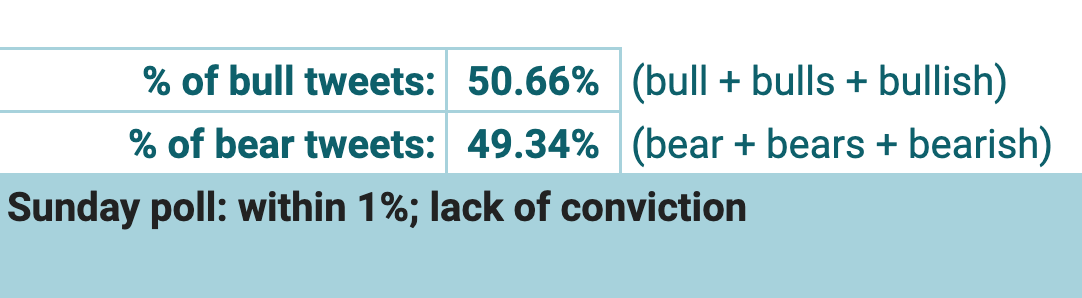
(Of the last 18,000 tweets containing SPX, $SPY or $ES, those including bull/bulls/bullish/bear/bears/bearish extracted, then % totals of each. Started April 2022; plan to track % of times Twitter is correct compared to the following weekly close. Tracking data will be added after the first 20 weeks.)
Roadmap
Wednesday - US CPI. YoY peaked in April however the declines have gone 0.3 to 0.2 to 0.1 (i.e., slowing). The market shrugged off a lot of bad news last week but a higher than expected read + last week’s NFP will be a new challenge.
If the CPI read is higher than expected but the market continues to push higher, the market is still not going down on bad news, so short term momentum is still up.
Friday - US preliminary GDP. As the Fed and US government have pretty much said ignore this as a read on recession (I actually agree with them, and there’s plenty of historic precedence for this- we just have recency bias due to NBER’s swift classification of the COVID recession), expect whipsaws but no real direction generated from this datapoint.
There’s also the Michigan Consumer Sentiment Index on Friday which has been in a nosedive since the start of 2022. Perhaps that’s why it is getting so much press when it’s a poor read on sentiment and, as noted below, has limited value in predicting equity weakness. Similar to GDP, expect volatility but it will not dictate market direction for the following week.
Equities:
At the moment this feels like trading early February 2020. Everything pointed to COVID (or, ‘Wuhan Coronavirus’ at the time) being a far greater deal that what was being reported in the news. Furthermore, there were significant signals in the market that it was about to crack. However, equities continued to grind higher for several weeks before finally capitulating. The market can go the wrong way far longer than expected, particularly if the trade is obvious.
FX:
I started the week short Dollar and got whipped about. Looking at the weekly closes, I don’t have much confidence in the trade - but recognise it was a messy week so the price action holds less weight.
USDCAD is at an interesting level to watch. Although it had a strong week, if oil can find a bottom it will help CAD in the short term. It is still fair to expect general USD weakness until the equity market rolls over.
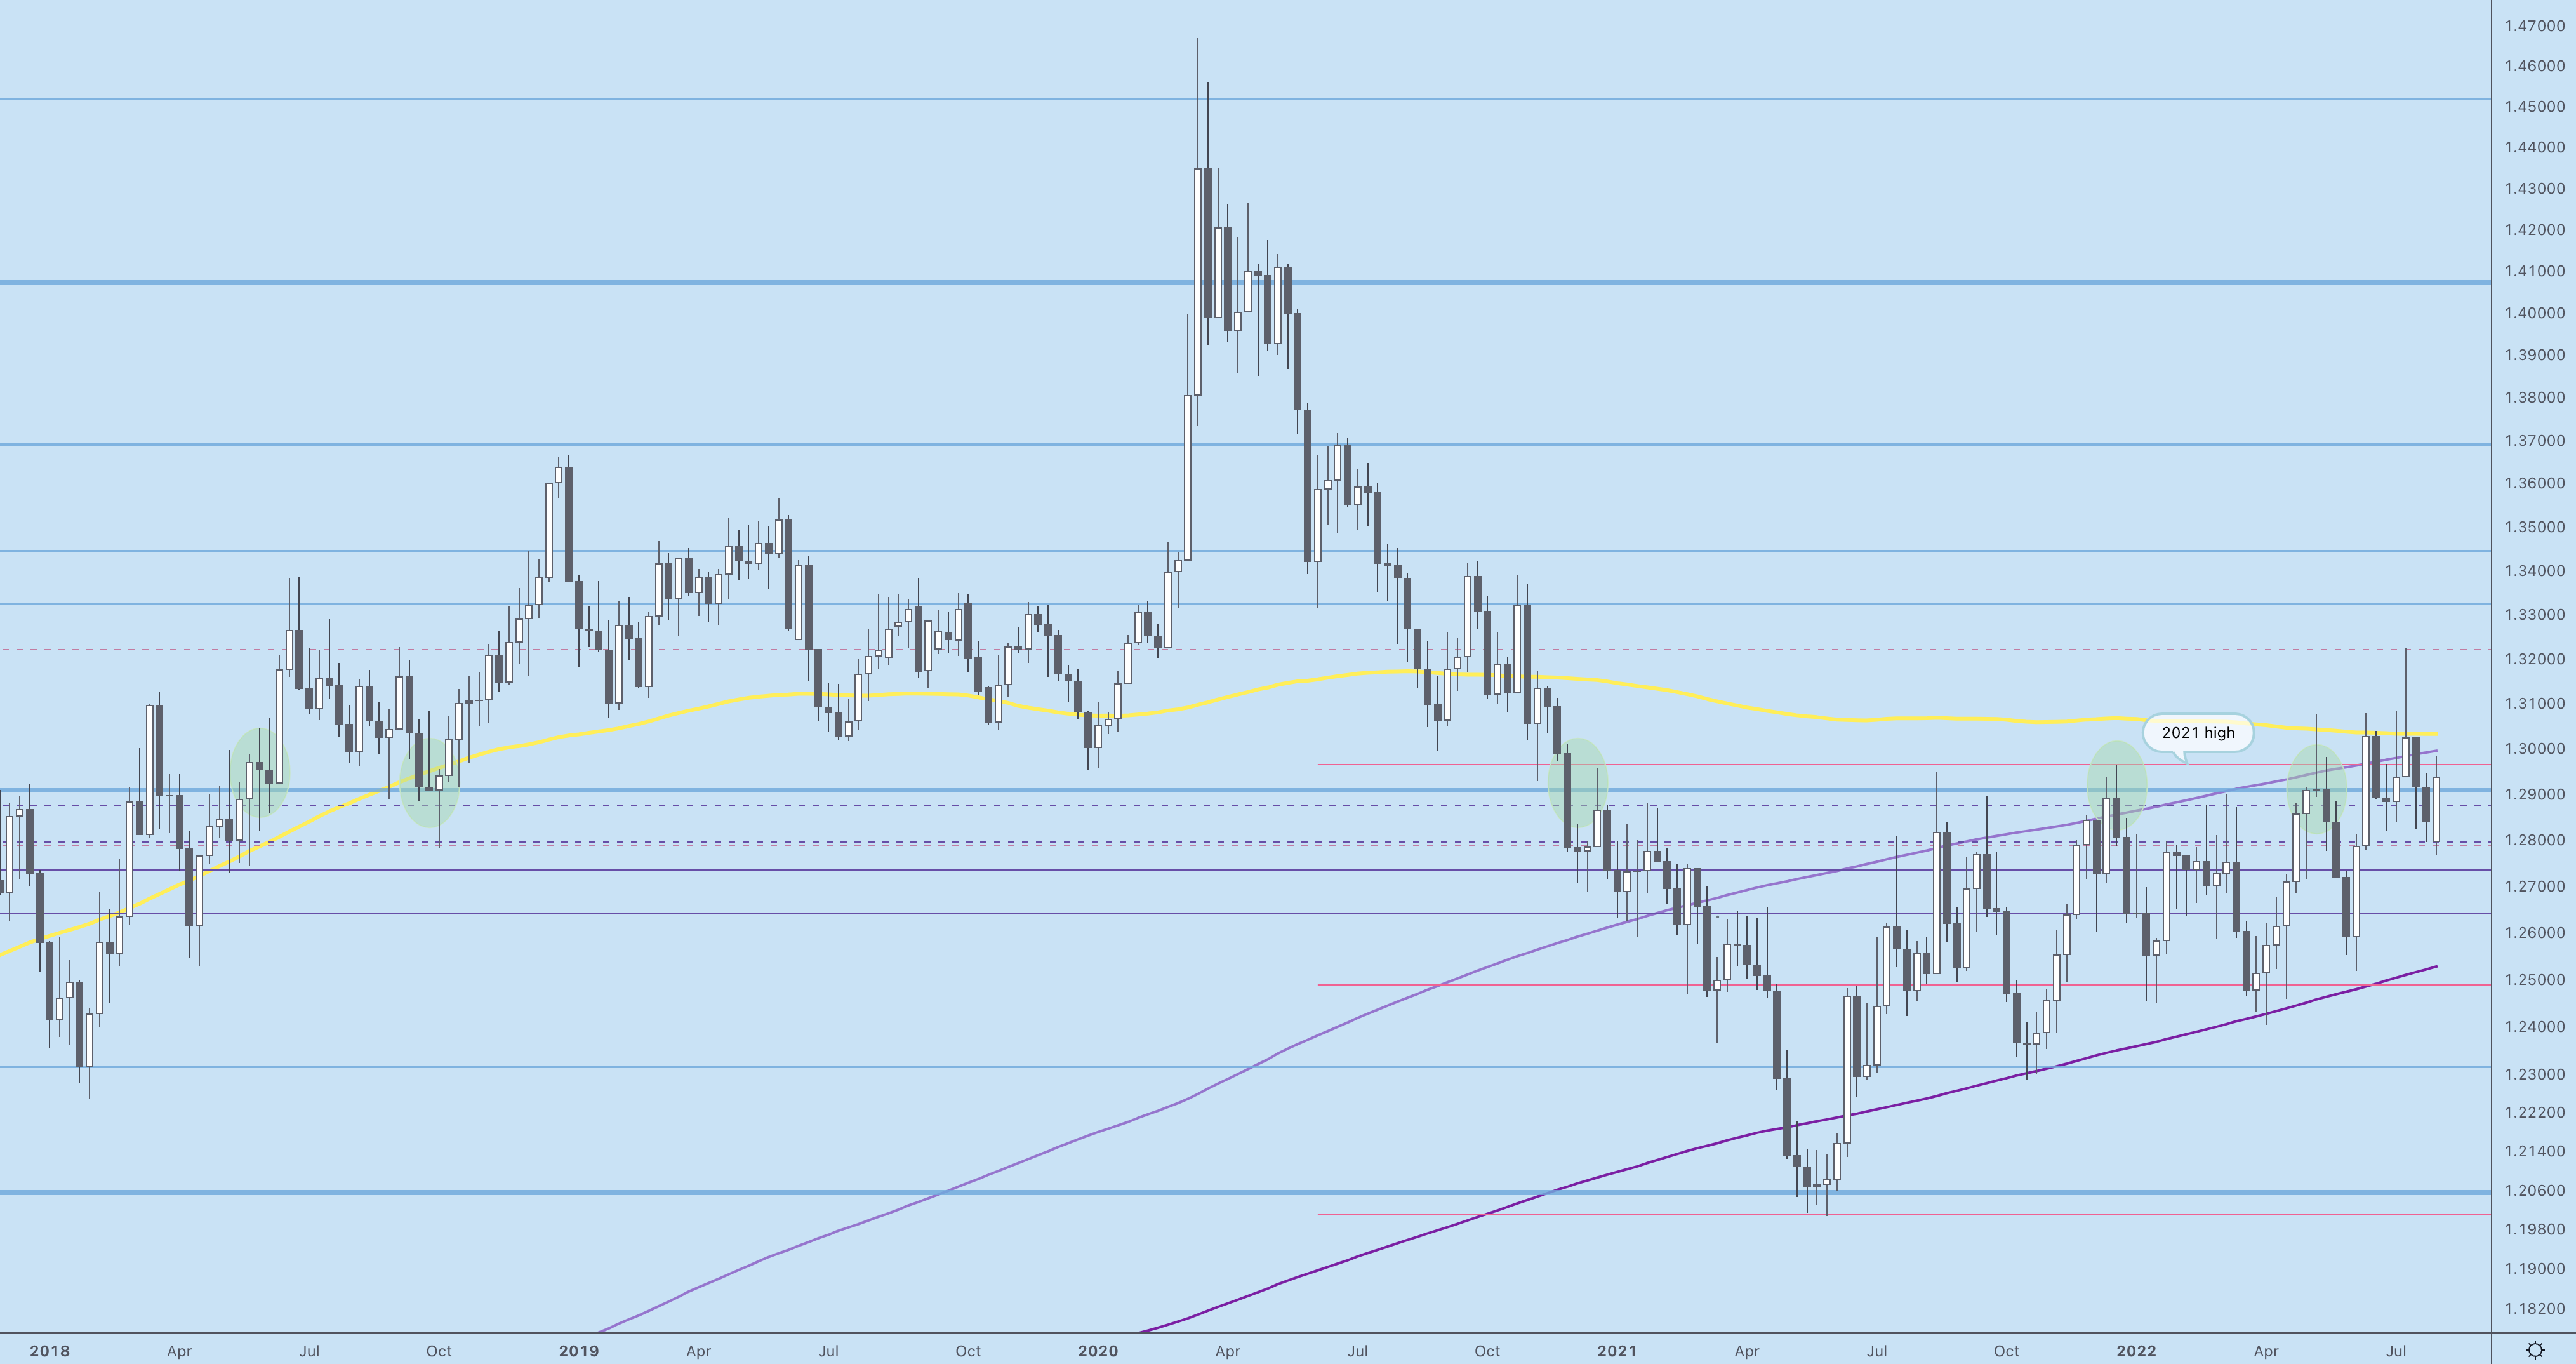
USDCAD weekly with the 200 (yellow), 400 (thin purple) and 500 (thick purple) weekly moving averages.
I occasionally look at 400 & 500 MA’s and it’s interesting to see the channel USDCAD is forming within them here. A break higher would be strong confirmation that the USD run has more to go. I am waiting for an ‘ideal’ pullback to 1.26 in order to buy again in a few weeks….which usually means it won’t come.
Precious Metals:
This space is getting interesting after the strong bounce in July. There’s many influences going into the price of gold at the moment, even more into precious metals in general. Given that further severe equity weakness is expected at some point in the next 6 months, it’s hard to get bullish in a space that always spikes lower in the final days of fear where correlations all move to one.
Trades Update
This has moved to a free Thursday trades record, also available (most weeks) on Substack:
Risk Index
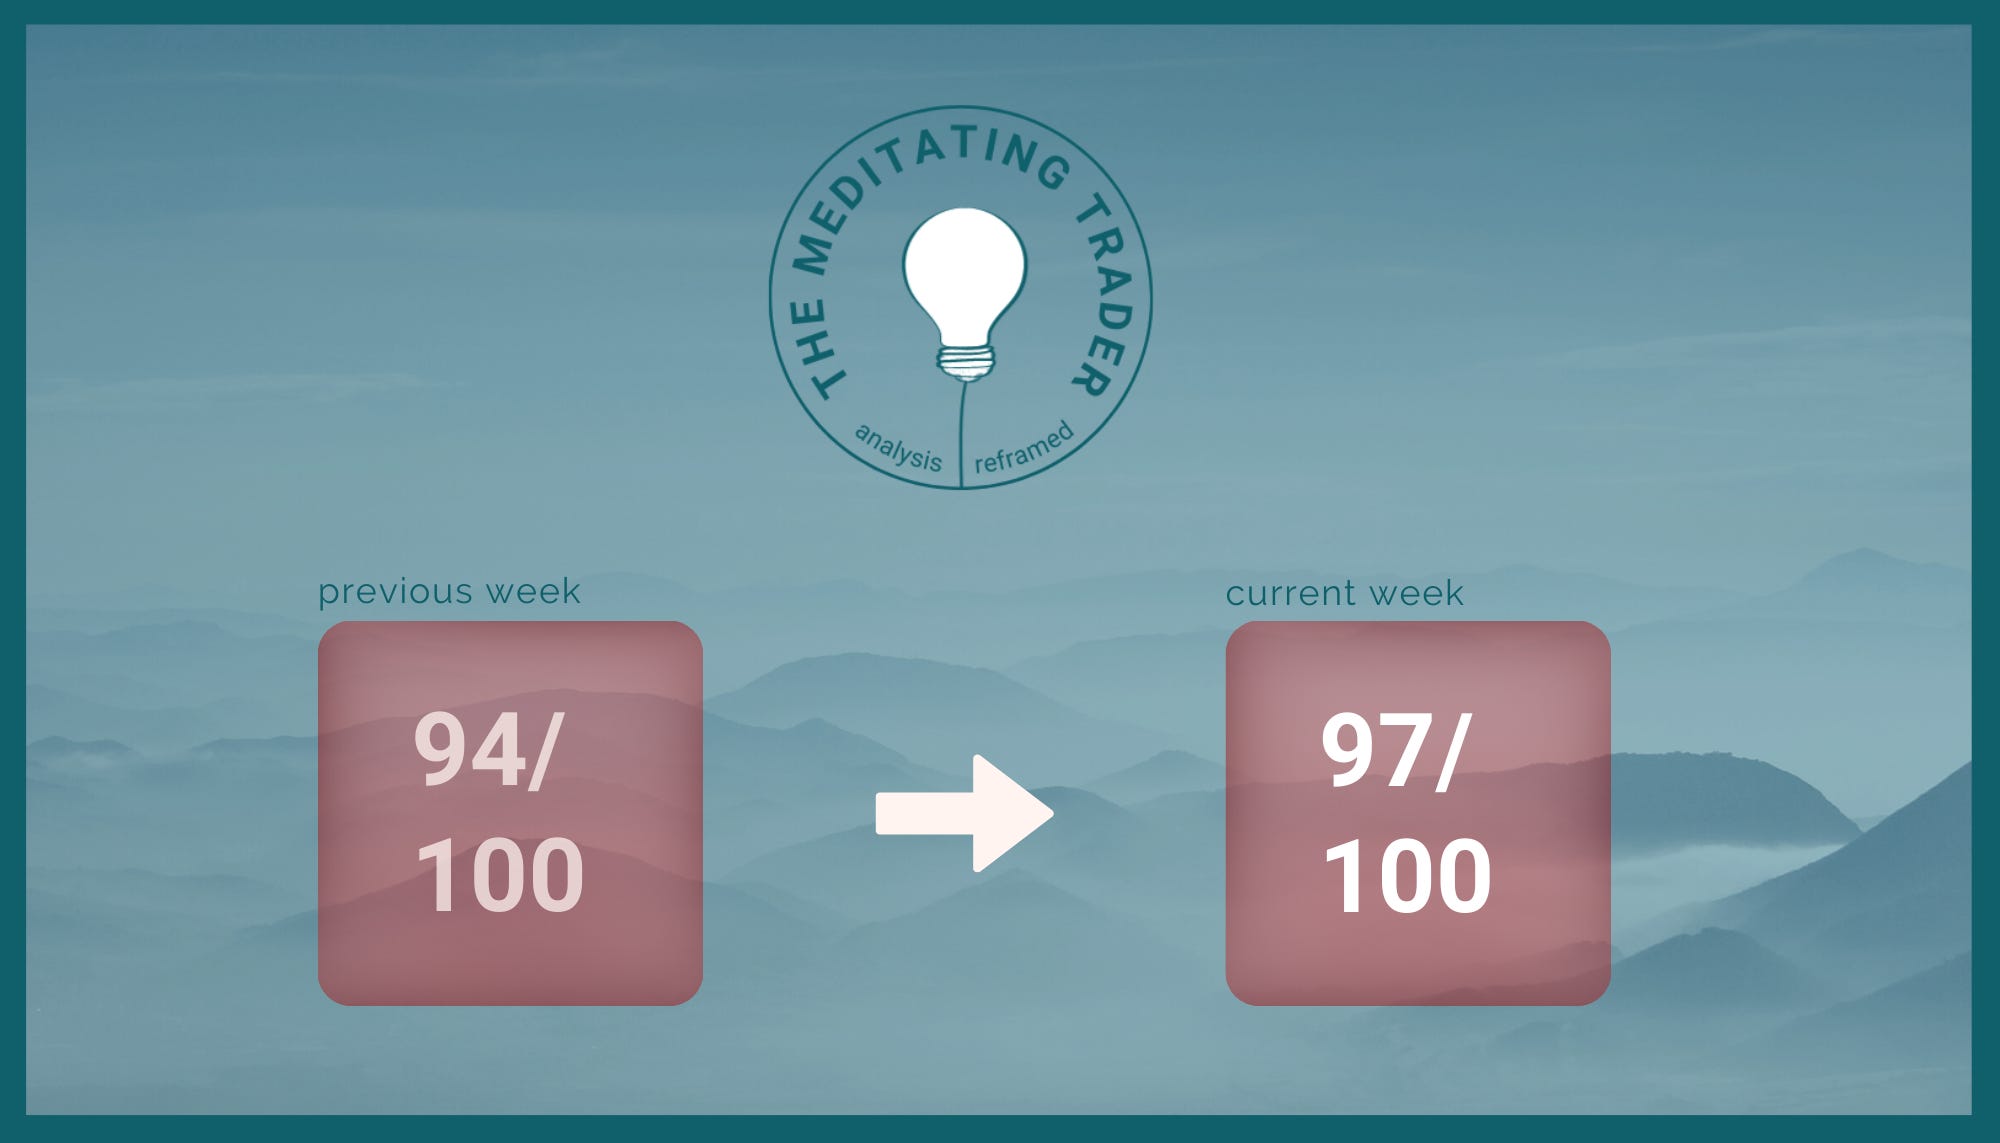
Under 50 = bullish, over 70 = bearish, over 90 = potential correction within 6 months
The Risk Index is a combined read of the trends of 68 intermarket spreads and indicators, from credit spreads to car sales in Spain.
1-year look-back:
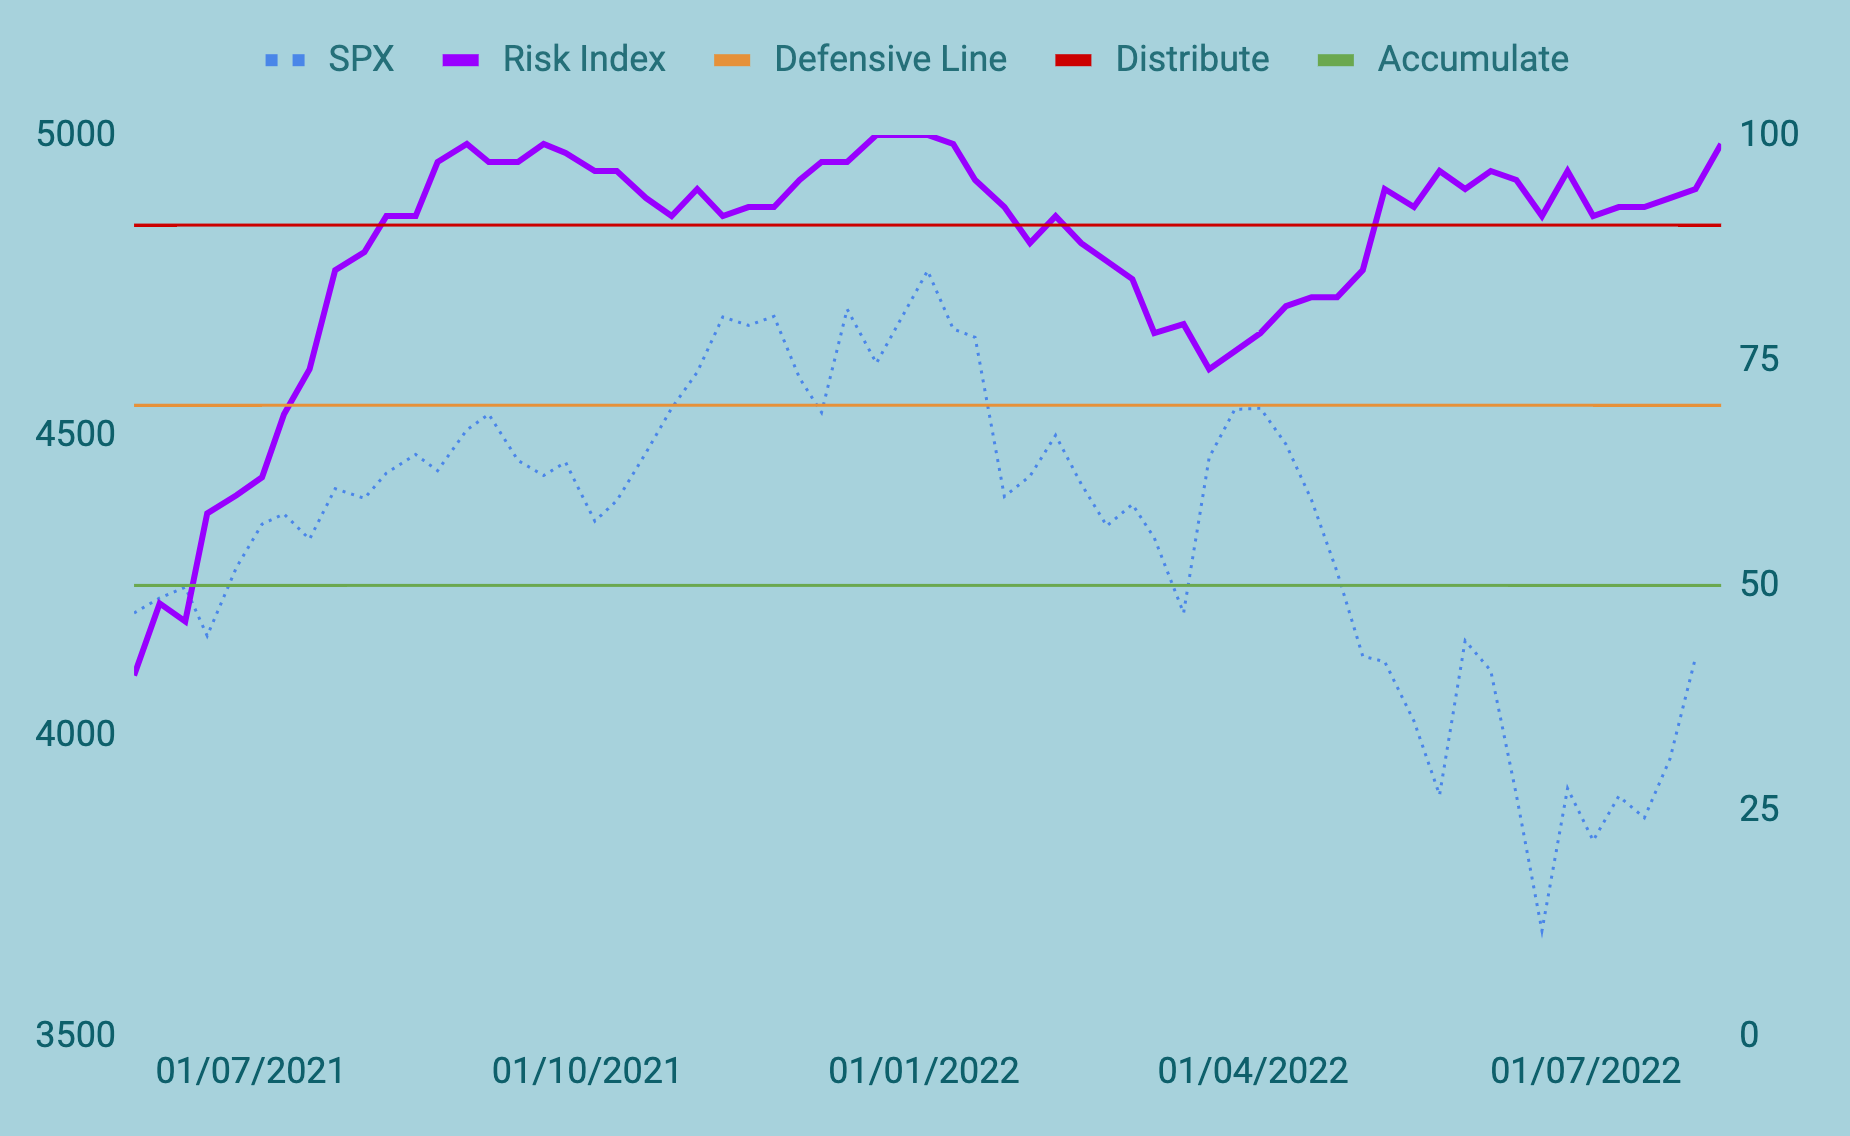
The market keeps taking one step forward and two steps back. Many intermarket signals are still indicating that in 6 months, price will be here or (likely) lower.
Themes to Watch
Keep reading with a 7-day free trial
Subscribe to Risk Index to keep reading this post and get 7 days of free access to the full post archives.